Table of Contents
Health Dashboard
The Health Dashboard provides a real-time view of issues across your TetherBoxes, Cameras, and Devices. Access it at Admin → Health.
Tip: For scheduled email summaries of these same issues, configure the Health Report in your notification settings. To plug TetherBox up/down status into an external uptime monitor such as Uptime Kuma, Uptime Robot or HetrixTools, see Uptime Monitoring.
Summary Tab
The Summary tab shows fleet-wide health and other common issues at a glance:
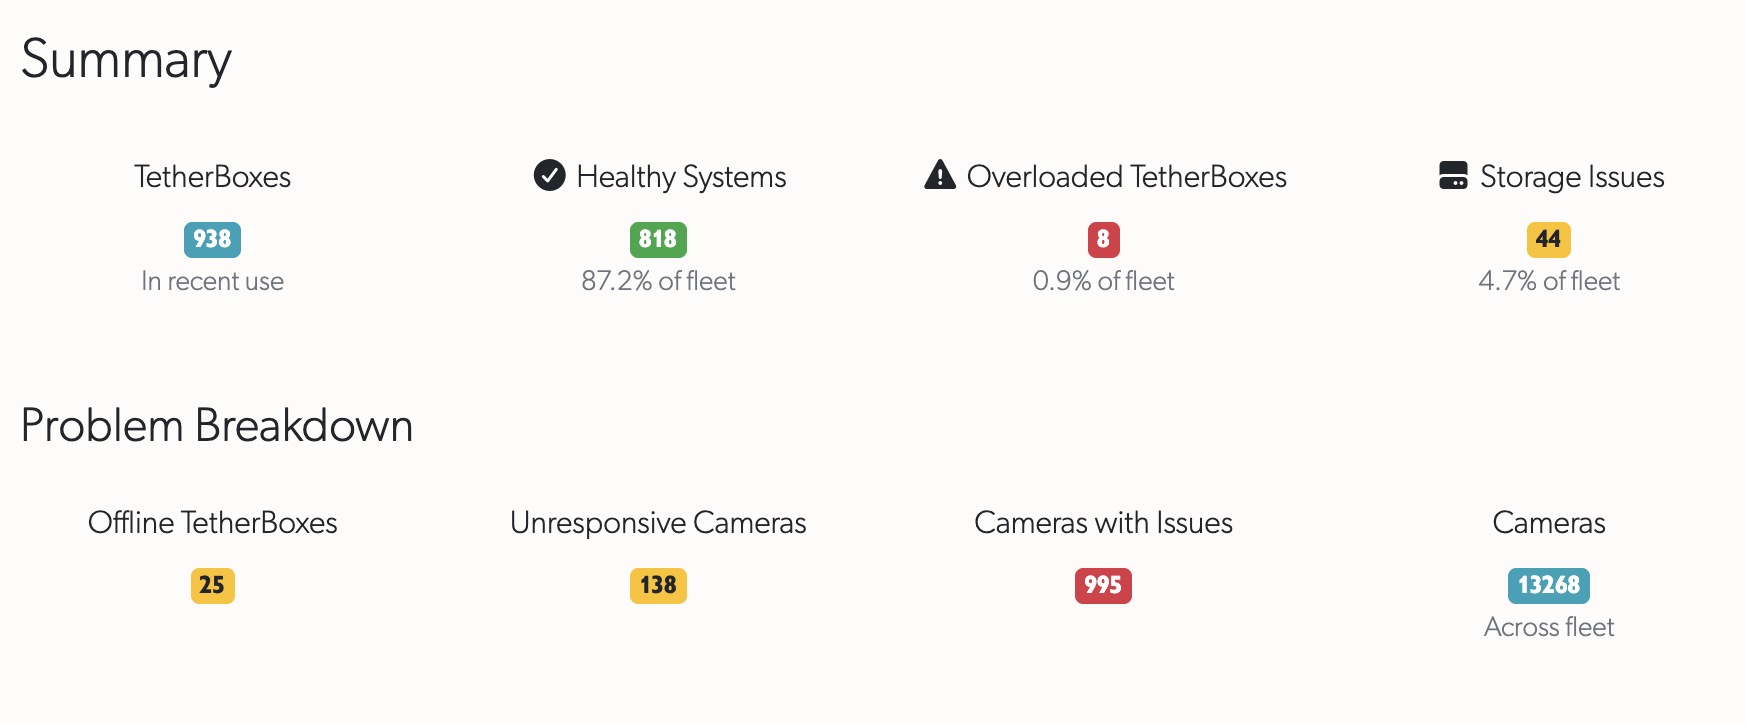
Fleet Health Overview:
- TetherBoxes - Total units in recent use
- Healthy Systems - Units operating normally (count and percentage)
- Overloaded TetherBoxes - Units with high CPU/memory load
- Storage Issues - Units with I/O bottlenecks
Problem Breakdown:
- Offline TetherBoxes - Units not communicating with servers
- Unresponsive Cameras - Cameras not recording as expected
- Cameras with Issues - Cameras reporting errors
- Total Cameras - All cameras across your fleet
- Recorders with a Failed Disk - DVRs and NVRs reporting a fault on one of their own disks
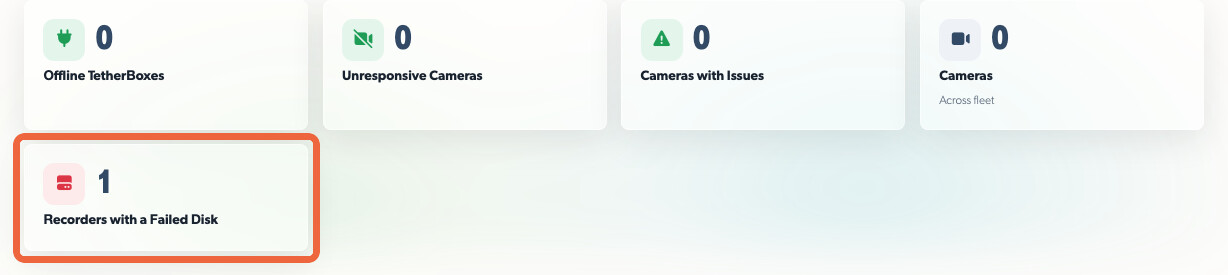
Tip: The card counts recorders, not disks. Click it to open the IP Devices tab, where the With failed storage table names the disk.
TetherBoxes Tab
The TetherBoxes tab shows issue-specific tables. Tabs only appear when issues exist - if all systems are healthy, you'll see a confirmation message.
| Tab | Description |
|---|---|
| Overloaded | Units with CPU load exceeding capacity. Consider reducing cameras, lowering bitrates, or upgrading hardware. See TetherBox Recording Capacity. |
| Offline for >5 days | Units offline for an extended period - unusual and requires investigation. See TetherBox Went Offline. |
| Offline | Units currently offline. Check power, network, and Internet connection on site. |
| Unresponsive | Units online but not sending heartbeats - indicates hardware or software fault. Contact support. |
| Potential Drive Issues | Units with drives reporting possible problems. May continue functioning but worth monitoring. |
| Expired Subscriptions | Units with lapsed subscriptions. |
| Insufficient Storage | Units with 128GB or smaller SSDs - consider adding external storage. See Storage Hardware Recommendations. |
| Stress Test Failed | Units that failed stress testing during activation. |
Tip: Click any TetherBox name to view its full status page with detailed diagnostics.
Cameras Tab
The Cameras tab groups camera issues into three categories:
| Tab | Description |
|---|---|
| Cameras with Issues | Cameras reporting errors or problems - click through to investigate. |
| Cameras Possibly Unresponsive | Cameras that haven't recorded recently despite being configured to record. |
| Footage Gap Cameras | Cameras experiencing stream interruptions causing recording gaps. See Footage Gaps. |
IP Devices Tab
Available if you have access to the IP Devices page. It splits device issues into two tables:
| Tab | Description |
|---|---|
| With packet loss | Devices losing packets on the way to the TetherBox. Check cables, switch ports and network congestion. |
| With failed storage | DVRs and NVRs reporting a fault on one of their own disks. The Suspected failure column repeats the recorder's own wording, such as hdd1: status error. |
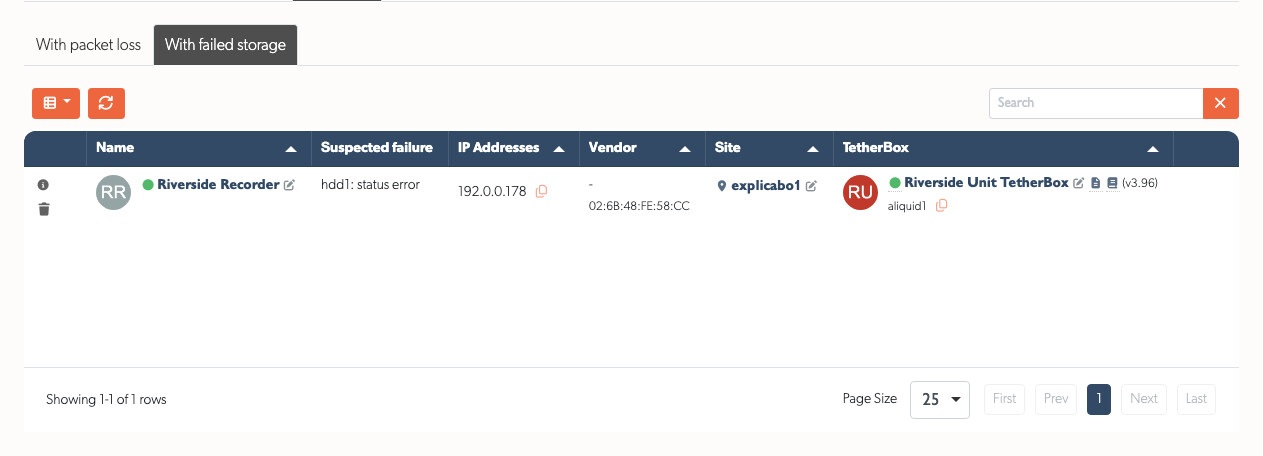
The disk verdict comes from the recorder itself, over ONVIF or the manufacturer's own interface. A reading we have not seen before appears in the recorder's own words. Replace the disk, then check the recorder's own storage page to confirm the bay reads healthy again.
Note: This covers disks inside a DVR or NVR. Drives attached to a TetherBox appear under Potential Drive Issues on the TetherBoxes tab, and in the Drive Replacement article.
Filtering
Use the sidebar filter to narrow results by timeline. This is useful when managing multiple organisations or regions - filter to see health data for specific areas of your portfolio.
Real-Time Updates
The Health Dashboard shows live data - refresh the page to see the latest status. Unlike the Health Report email which provides periodic snapshots, the dashboard always reflects current conditions.
Health Dashboard vs Health Report
| Feature | Health Dashboard | Health Report |
|---|---|---|
| Access | On-demand at /health | Scheduled email (daily/weekly/monthly) |
| Data | Real-time | Snapshot at send time |
| Interactivity | Click through to resources, sort tables, filter by timeline | Links to resources in email |
| Issue Detail | Full tables with all affected resources | Summary counts with top items |
| Use Case | Active troubleshooting, fleet overview | Regular monitoring, delegation to team |
Tip: Use both together - the Health Report catches issues you might miss, while the Dashboard lets you investigate and resolve them.
Related Articles
- Health Report - Scheduled email summaries of health issues
- TetherBox Troubleshooting - Diagnosing TetherBox problems
- TetherBox Recording Capacity - Storage and performance planning
- Footage Gaps - Understanding and resolving recording interruptions
Referenced in:

